Rectangular hyperbola example
Categories: coordinate systems pure mathematics
A rectangular hyperbola has the parametric equations:
$$ \begin{align} x = c t\newline y = \frac{c}{t} \end{align} $$
Where $c$ is a positive constant, and $t$ is the independent variable.
We can plot this curve by calculating the values of $x$ and $y$ for various values of $t$, and drawing a smooth curve through them.
Curve for c = 1
Assuming $a = 1$, the parametric equations simplify to:
$$ \begin{align} x = t\newline y = \frac{1}{t} \end{align} $$
The values are shown in the following table, for $t$ in the range -3 to +3:
| t | x | y |
|---|---|---|
| -4 | -3 | -0.25 |
| -2 | -2 | -0.5 |
| -1 | -2 | -1 |
| -0.5 | -0.5 | -2 |
| 0 | 0 | undefined |
| 0.5 | 0.5 | 2 |
| 1 | 1 | 1 |
| 2 | 2 | 0.5 |
| 4 | 4 | 0.25 |
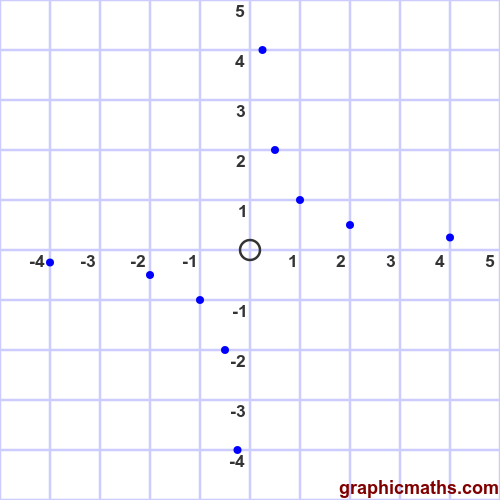
Here are the points plotted on a graph:
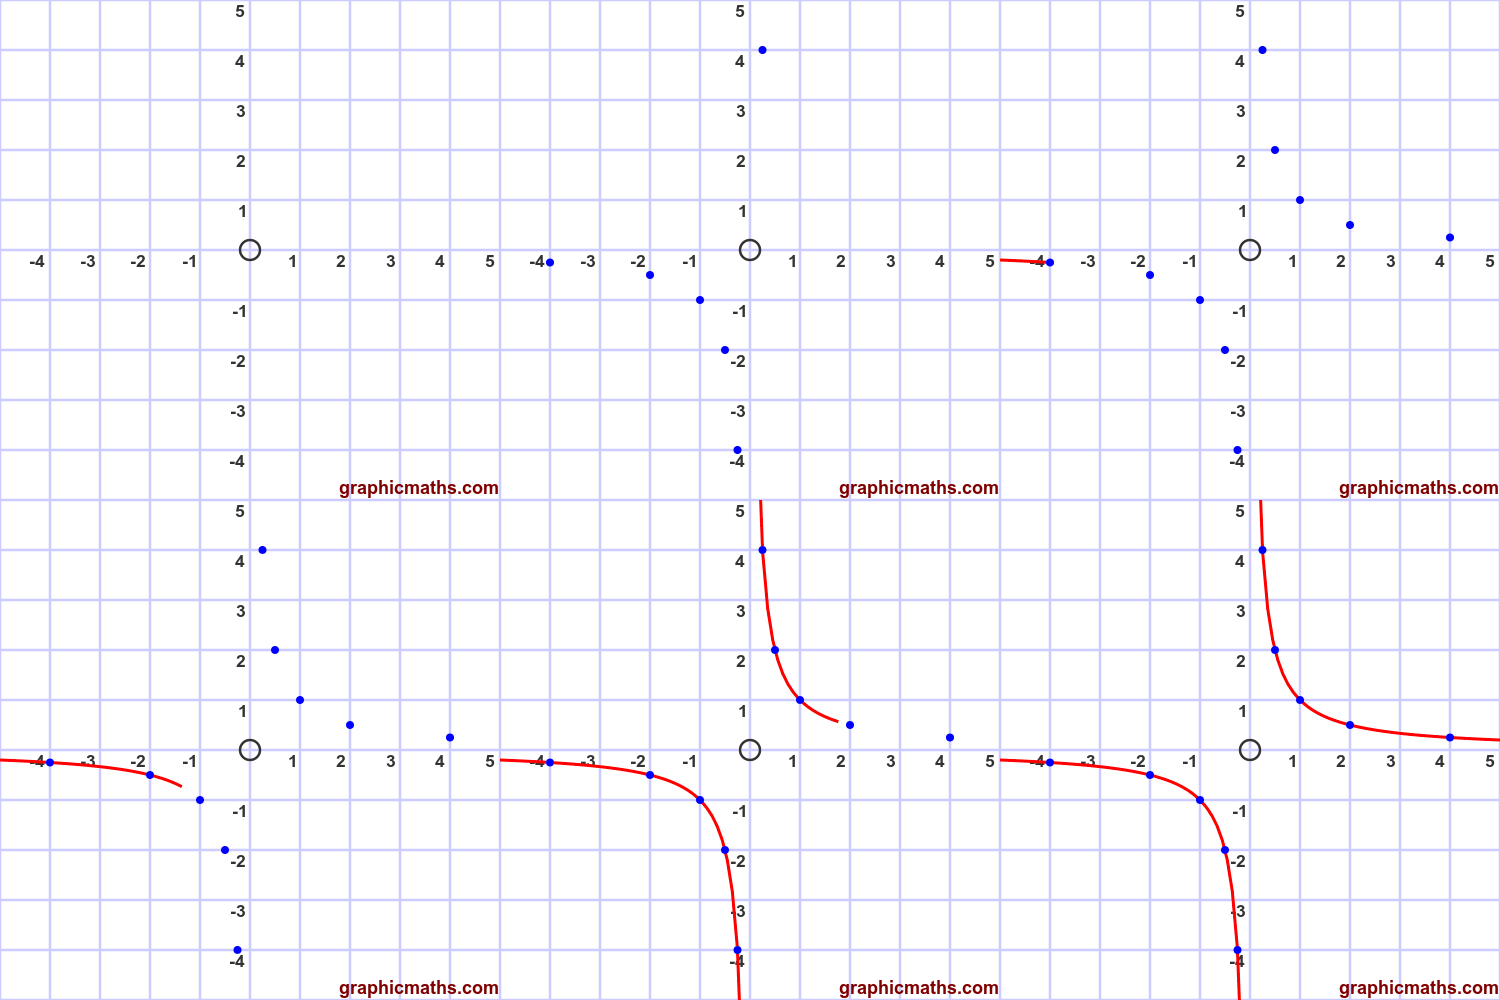
This curve is actually a standard reciprocal curve, as shown here.
The curve can be drawn by plotting the points and drawing a smooth line through them. Notice that the curve value is undefined for $t = 0$:
Related articles